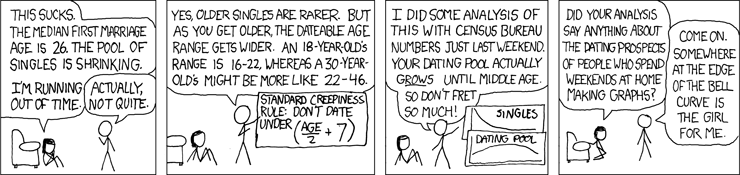
So I was THAT curious about what it would exactly look like, that I made the graph in matlab - the lower age being the lowest age you're "allowed to date" and the top being the "top age that will date you".

So far I've managed to skirt the top blue line, but haven't actually gone lower than around the mid point.
What do escapists think, is this a fair representation? Should I tweak the graph some more for a better correlation?
Obviously there aren't any 185 year olds to keep the 100 year olds company, but you get the gist
For those of you who have matlab, here's the (surprisingly short) script if you want it.
%x = your age, l = age of partner min, u = age of partner max
x = 0.01:0.01:100;
l = x/2+6;
u = (x-6)*2;
ur = (x-7)*2;
lr = x/2+7;
plot(x,u,'-b',x,l,'-b',x,lr,'-r',x,ur,'-r')
set(gca,'XTick',[0 5 10 15 20 25 30 35 40 45 50 55 60 65 70 75 80 85 90 95 100])
set(gca,'YTick',[0 5 10 15 20 25 30 35 40 45 50 55 60 65 70 75 80 85 90 95 100 105 110 115 120 125 130 135 140 145 150 155 160 165 170 175 180 185 190])